SQL Monitoring in OEM 12c
SQL Monitoring was instrumented and available for command line use in the first release of the Oracle Database 11g. The graphical user interface to monitor active running SQL made its debut in Grid Control 10.2.0.5 and Database Control 11.1.0.7. Basically, the data from the GV$ views, is aggregated and presented in a user-friendly interactive fashion in the Enterprise Manager. OEM 12c has changed the look and feel a bit.
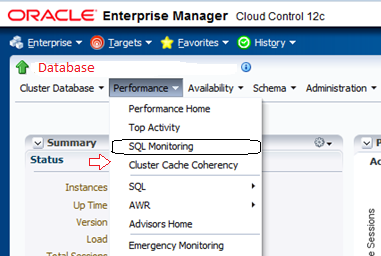
Select the database you would like to monitor. Next select Performance and then select SQL Monitoring from the drop down as shown below.

You will be prompted to enter the password of sys or system, which ever you would like to use. Once the credentials are verified, you will be shown SQLs over a period of time. You will have the options to choose the time frame for SQL monitoring.

Each row on this page shows an instance of a SQL execution that has or is being monitored. By default, rows are ordered in the table such that most recent executions are shown first with the first few rows always showing SQL executions that are in progress. Information on this page presents only key data about each execution: global information like SQL id and text, parallel DOP and statistics on the execution like status, start and end times, duration, database time breakdown, IO statistics. This page is refreshed on a periodic basis and you can change the refresh interval or make the refresh manual.
Click on any entry you would like to check and you will go to “Monitored SQL Executions” page. This page contains additional information about a specific SQL execution. If the execution of interest is still in progress, it is possible to get real-time updates on the execution statistics as well as to see what operation of the plan is being executed at that time. Additionally, it is possible to see a lot of useful information about the SQL execution, including: SQL-level statistics for the execution (database time breakdown, CPU, I/O read/write breakdown), degree of parallelism for the query, start and finish time of the execution, etc.
 Additionally, it is also possible to get this data by going to selecting Performance Home instead of SQL Monitoring and then going towards the bottom of the page. You will find “SQL Monitoring” link there, which will also take you to “Monitored SQL Executions.”
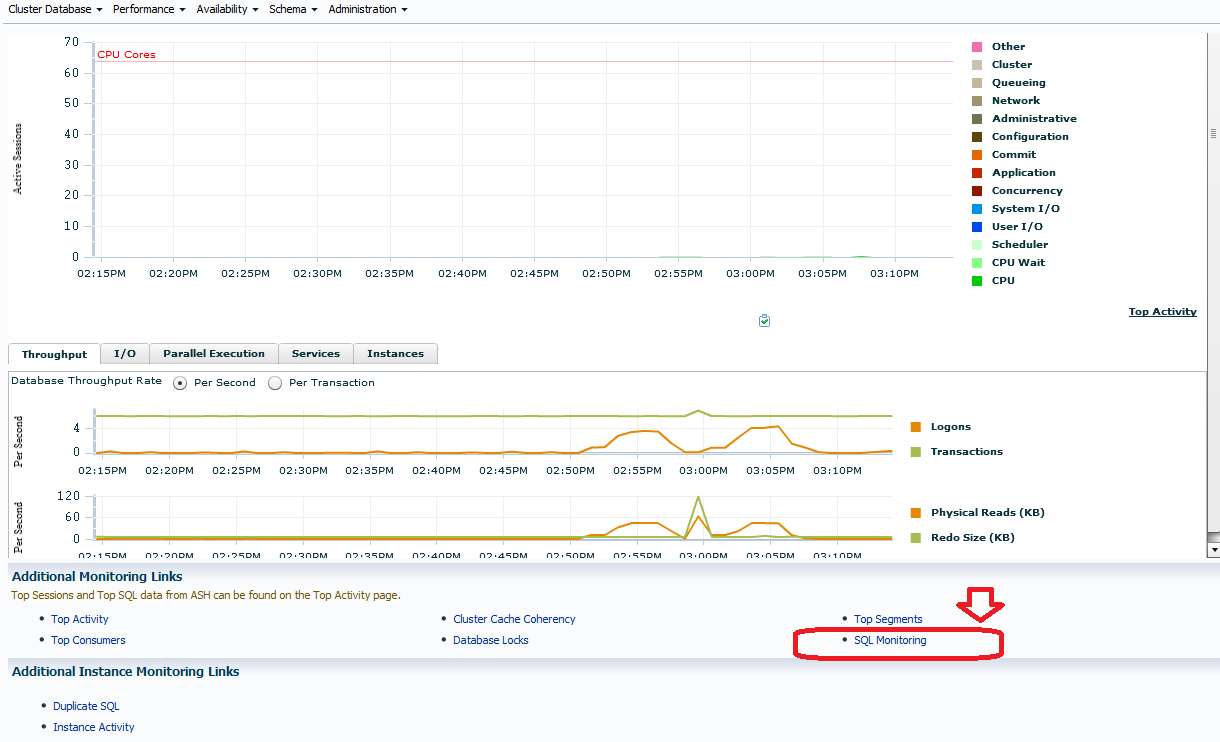
Monitored SQL Execution Details page is a drill down for an individual SQL statement from the Monitored SQL Executions page.
On the very top of the screen, next to the title of the page, there is a status icon for the SQL statement that this page is monitoring. Three types of icons to describe the state of the SQL statement are available. They are: Done, Running, and Failed. As the mouse goes over the icon we get the description of it:
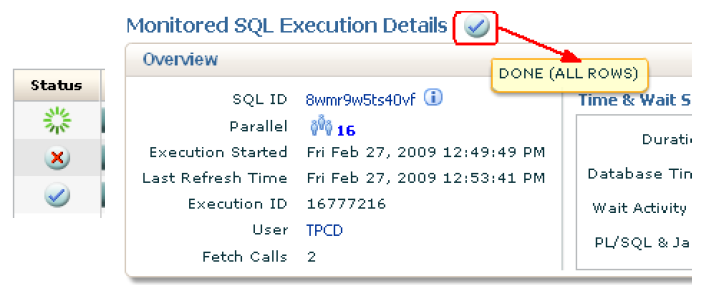
Also, it is worth noting that if the SQL has failed, the Oracle error number and message will be displayed via the icon tooltip. Next thing is the SQL ID when we hover the mouse pointer over it we get the SQL text corresponding to the running query.
Function Based Indexes in PeopleSoft
Which is the Best Browser to run PeopleSoft on?
Understanding PeopleSoft Trace File for Performance Tuning
SQL Profiles in Oracle
PeopleSoft Performance Benchmarks
Enabling Automated SQL Tuning in Oracle 11g
How to Identify User and SQLs in an Oracle database?
Automated SQL Tuning in Oracle 11g
Session expired
Please log in again. The login page will open in a new tab. After logging in you can close it and return to this page.