PeopleSoft Trace Analyzer – TraceMagic
PeopleSoft trace files contain tons of information and depending on the kind of information you need from a trace file – it can turn out to be a daunting task. Wouldn’t it be nice if there was a tool to analyze the PeopleSoft trace files? If you are ready to make sense of *.tracesql files in a fraction of the usual time, this post is for you.
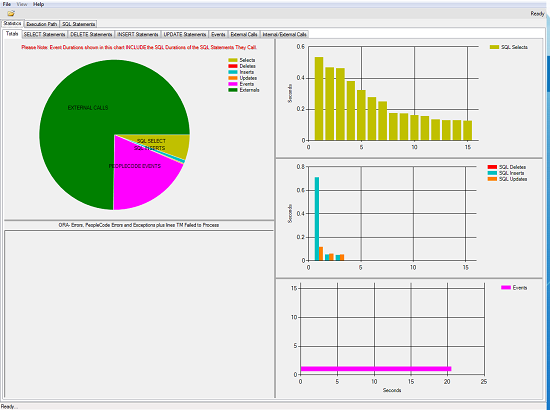
TraceMagic, provided by Oracle is a utility that gives PeopleSoft system administrators, programmers and support engineers the ability to quickly isolate performance bottlenecks in SQL Statements and/or PeopleCode functions. It accomplishes this by turning the text-based, time-ordered tracesql file into a sortable-grid display, allowing the user to quickly locate system performance issues.
TraceMagic was released in July 2012 and the tool was developed by the CoE using Microsoft Visual Studio 2010. Trace Magic requires Version 4 of the Microsoft dot.net Framework. All you need to do is to download the TraceMagic zip file, unzip it and run the setup.exe program used to install TraceMagic. The setup program will inspect your machine for the presence of the prerequisite software, and request permission from the installer to download and install the required software if needed.
TraceMagic has been tested on the following platforms:
- Windows XP (32-bit)
- Windows 7 (32-bit)
- Windows 7 (64-bit)
Other platforms may or may not function correctly with TraceMagic. Platforms that will not run the Microsoft dot.net framework will not likely run TraceMagic. The installer will create a Start Menu Icon under “Oracle Corporation > Tools & Utilities > Trace Magic and a Desktop Icon.
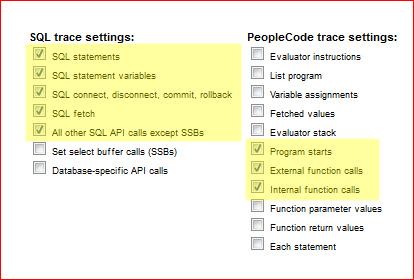
TraceMagic is designed primarily to address the difficulty in working with tracesql files when attempting to determine which SQL statement(s), and or PeopleCode programs are causing performance problems. As such, it tends to assume that certain trace flags were set during the creation of the trace file. While other trace flags settings will work with this tool, it is highly recommended that the flags set during the creation of the tracesql file be those eight checked settings shown below.
You can download TraceMagic as per your system configuration either from the URLs provided below or logon to My Oracle Support and search for TraceMagic to get the relevant link:
I had to restart my system before which TraceMagic was not displaying the results properly. Once I got through the issues – it was nice and easy to get the needful information quickly. Please use the comment box to let us know if you have any questions.
Hi All,
Commit time and fetch time? Are they included in total time for a SQL instruction?
Suppose we have:
Total Time Number of Calls Un-Traced Number of Fetches Exe Time Fetch Time SQL
0.046000 44 36 0.000000 0.046000 0.000000 SELECT OPRDEFNDESC FROM PSOPRDEFN WHERE OPRID = :1
Should we multiply 0.046 (Total time) by 44 (number of calls ) to have elapsed time for this select instruction?
How to read the graphic on first tab (summary ; statistics)?
Vertical axis is in seconds. What does it show?
Horizontal is in which unity? What does it show?
Thanks and Regards.
Hi Apurva,
Can we use Tracemagic utility for reading and analysing Process(AE Program) trace.
Is there a way to deploy this silently via .bat file?